Archive for the ‘Uncategorised’ Category

Investors Need More Meaningful Risk Measures

Wednesday, July 22nd, 2015

Wealth management The measurement and communication of risk for investment funds is high on securities regulators’ radar. They continue to review this important issue and we’re awaiting their final decision. It’s striking how many years have passed, yet the industry continues to debate many of the same issues.

In 1997, I started working for a firm that was trying to move the industry away from opaque academic risk measures like standard deviation to more common-sense methods. I have written several times that the industry standards for risk measure and illustration are inadequate and meaningless. The announced changes in fund risk ratings offer plenty of new evidence to support my argument.

Risk Ratings

I tracked risk rating changes on 44 mutual funds since last October. The table below lists the affected 28 unique funds – excluding 16 funds that are simply other incarnations of the 28 – and summarizes the risk rating changes and related risk statistics.

Risk Ratings

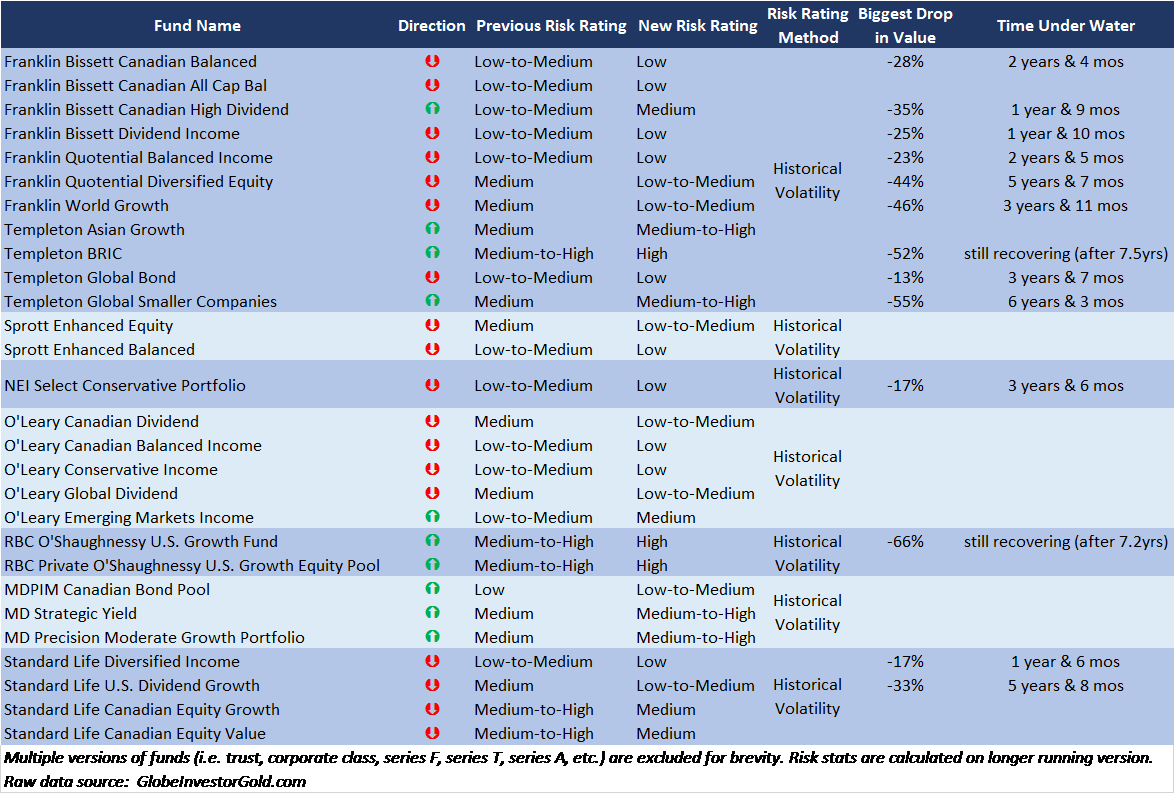
Nearly two thirds of the affected funds saw falling risk ratings with just over one third seeing a bump up in risk rating. In my view, an investor’s exposure to risk should not fall after a multi-year run up in prices. A case can be made for risk being higher since we are likely closer than not to the next significant price drop.

But since the industry remains stuck on measuring risk using standard deviation – and applied to arbitrary scales – fund sponsors are blindly lowering risk ratings in droves. And risk ratings will only rise under this system after the worst of the next decline has already occurred – i.e. when it’s too late.

Volatility in the Markets

Those using the industry standard risk rating method will update volatility measures annually. If volatility has fallen sufficiently over the past three or five years, there’s a good chance the risk rating will fall. The thing is that usually volatility falls during bull markets and rises during bear markets. By the time this is captured by fund companies’ annual updates, investors will have already been hurt. Even worse, when bear markets fall out of the three and five years periods used to assess risk, standard deviations are bound to fall.

A system designed to truly inform and protect investors would look far back enough to capture bear market performance either for the fund or – if it’s too new – for its benchmark. Combining this with a more common sense measure – i.e. how much a fund lost in its last big decline – puts these new risk ratings in a different light.

Of the 28 funds in the above table, 13 have enough history to look at past bear markets. Six of these 13 funds sport a new “low” risk rating. These six so-called “low risk” funds lost an average of more than 20% in the last bear market and spent 2.5 years under water. I don’t know anyone who considers this low risk.

The few other funds that were re-assessed as having “low to medium” risk sport an average bear market loss of more than 41% and spent more than 5 years climbing back to the previous high.

If the industry continues to argue – as most fund companies have – that the standard risk rating method works well, they will need to rethink the purpose of these ratings. All fund companies are legal fiduciaries. Yet a true fiduciary mindset would attempt to measure and illustrate risk in ways that better inform investors.

In my submission on this topic to Canadian Securities Administrators last year, I clearly outlined the weaknesses of the status quo and provided strong arguments for with examples of more meaningful solutions (e.g. see page 4 of my submission). The latter reflects what we show to clients both before they engage our services and through our periodic reporting. It’s time for the broader fund industry to abandon its opaque technical approach and become more investor-friendly so that its end clients can better grasp risk before they invest.

>> HighView Financial Group is an investment counselling firm for affluent families and foundations. We build portfolios based on each client’s unique goals and tolerance for risk. Schedule a complimentary discovery session to see if we’re the right investment stewardship counsellors for you.

You may also be interested in:

Pros and Cons of Robo-Advisors: Are They Here to Stay?

Monday, June 29th, 2015

Wealth ManagementMuch has been written about newer investment advisory firms that dispense advice through user-friendly websites, called Robo-Advisors. This new breed of advisory firms offers many potential benefits but also faces many headwinds.

Potential Benefits of Robo-Advisors

Dealing with an advisor face-to-face can sometimes be intimidating, which can act as a barrier to obtaining advice. Leveraging the power of user-friendly technology removes that barrier for the tech-savvy while creating a scalable platform for these firms. This keeps costs low; a key benefit of Robo-Advisors.

This is a good example of a market naturally establishing a pricing floor for basic investment advice – i.e. 35 basis points (0.35%) per year of the value of client portfolios plus tax and product fees. Some advisors will be challenged and pushed out of the business. And unlike the vast majority of those who call themselves “financial advisors” or something similar, every Rob-Advisory firm I’ve looked at is a licensed portfolio manager – i.e. a legal fiduciary.

Drawbacks of Robo-Advisors

The positive view of Robo-Advisors thus far has largely been driven by its low cost – piggybacking on the popularity of low cost index funds and exchange traded funds (ETFs). Yet none that I’m aware of actually structures portfolios based on indexing’s underlying theory. The basic idea of indexing is to obtain the broadest exposure possible at the lowest available cost.

A two-ETF portfolio is a prime example of indexing; one covering all of the world’s equities and another the world’s bonds. But Robo-Advisors tend to overlay their own active management by using ETFs that offer both passive and active exposure to financial markets – or emphasizing narrow slices of financial markets. This is quite a departure from indexing’s low-cost simplicity. By failing to take full advantage of indexing’s appeal, Robo-Advisors are missing an opportunity to maximize their cost advantage over incumbents.

A simple indexing portfolio costs about 20 basis points or 0.2% annually. Assuming a Robo-Advisory fee of 0.35% per year, the total investment management cost would come to a grand total of 60 basis points annually including HST. Instead, every firm I’ve seen is either buying many different slices of financial markets or adding lots of actively managed ETFs – significantly pushing up total costs.

Robo-Advisors resist simpler structures due to the challenge of convincing investors to pay ongoing fees to buy, hold and rebalance two or three ETFs. It’s an easier sell to propose a more complex structure that looks more difficult to replicate and maintain. And yet simpler structures offer good value – i.e. low maintenance, low cost and – most importantly – in the embedded discipline that so few investors exhibit on their own.

Accordingly, Robo-designed portfolios are more costly and less efficient than they could be. And just about every one I’m aware of employs sub-optimal rebalancing. Layer on some of the conflicts facing a few Canadian Robo-Advisors and it becomes apparent how vulnerable they all are to a looming competitive threat.

Competition for Robo-Advisors

In the U.S., discount broker Charles Schwab offers its own Robo-Advisory platform, using Schwab’s own competitively-priced ETFs. They make money on the ETFs but charge nothing for advice. There’s no reason why BMO couldn’t do the same.

BMO already offers an automated advisory service, though it’s expensive and not focused on ETFs. But they have the platform. And they boast the largest ETF family among Canadian banks, which makes them ideally positioned to be a mega Robo-competitor.

RBC – which has a growing ETF family – can do the same. So can TD or CIBC; each of which boasts some of Canada’s oldest and cheapest index mutual funds.

All Robo-Advisory firms are surely well aware of this very real threat.

The Future for Robo-Advisors

Getting advice remotely isn’t a fit for everyone. In my view, those with larger and more complex needs and portfolios will always gravitate to face-to-face advisors offering a deeper and more interactive discovery process to feed into investment plans that quantify goals. This leads to a more customized solution to push clients toward their goals.

My view is biased, of course. But I see the continuing growth of HighView and its peers as validation of this view. Still I expect Robo-Advisors to survive and thrive as a stand-alone segment. As has happened in the U.S., they may also evolve as technology platform providers for other advisors.

The second phase of regulators’ Client Relationship Model (CRM2) will be implemented in a year. Ontario continues to explore the idea of regulating financial planners. And securities regulators are still discussing the notion of applying a fiduciary or ‘best interest’ standard to financial advisors. It’s the more mainstream retail advisors that are most at risk because of Robo-Advisors’ focus and the expected impact of CRM2.

Regardless of the direction of those initiatives, the idea of dispensing investment advice online or through a mobile app likely has staying power. The question is whether they’ll survive as independents or whether this is just another new segment that the banks will eventually own.

>> HighView Financial Group is an investment counselling firm for affluent families and foundations. We build portfolios based on the unique goals of each client. Schedule a complimentary discovery session to see if we’re the right investment stewardship counsellors for you.

You may also be interested in:

Focus on meeting your goals not on investment debates

Monday, May 4th, 2015

Focus on GoalsETFs vs. mutual funds. Indexing vs. active management. Industry professionals and investors alike have staked their respective turfs on each of these issues with a level of passion usually reserved for religious or political debates. Yet breaking down each issue’s most important components shows that most are focused on the wrong factors.

Indexing vs. Active management

Indexing is an investment strategy that aims to mirror a particular financial market index – e.g. S&P 500. The indexes tracked by such funds are known as “market cap indexes” because they put heavier emphasis on companies with higher market capitalizations (i.e. the market value of all of a company’s shares outstanding).

Active management is the use of any strategy aimed at outperforming market-cap indexes. Many studies and articles have proclaimed the failure of active management – such as this recent article – showing that 75% of mutual funds lag comparable indexes. But it’s not that indexing is an inherently superior strategy or that active managers aren’t skilled.

A strong majority of active managers have outperformed indexes over time – before deducting fees and expenses. The costs incurred to access active management often eat up all of the index outperformance – i.e. value added – and then some. So it’s the cost advantage that makes indexing an attractive option – particularly for do it yourself investors.

But some investors are in a position to access cheaper active management – and they should look at this issue differently. Who are these lucky chaps? It could be anybody that is part of a large pension plan. Professional associations also sometimes provide members with access to relatively cheaper active management. And owners of 7- or 8- figure investment portfolios will find that cheaper options open up simply because they have more money to invest.

For example, the active managers that we engage to select stocks and bonds for our clients’ portfolios generally add about 0.3% to our clients’ cost vs. using indexing alternatives. Some of the managers we hire cost more than index funds but some cost less. Our clients’ 0.3% per year premium is a far cry from the 1% to 2% annual fee differences implicit in all of the pro-indexing articles that I’ve read.

In other words, active management has good odds of adding value before costs. Indexing often wins because it has a massive cost advantage over most actively managed products. But if your circumstances allow you to effectively eliminate the big cost difference between indexing and active management – particularly if you need advice – you should have a very different perspective on your choice of strategy.

Focus on process, exposure and cost

Similarly, most associate indexing with the exchange traded fund (ETF) structure. And yet one has nothing to do with the other. The first ETFs housed indexing strategies; so indexing is usually associated with ETFs and low fees – and active management with mutual funds and high fees.

But today more TSX-listed ETFs track active strategies (48% of all ETFs) than broad market indexes (11%). (The remainder passively track narrower market slices – e.g., energy stocks.) So much like the indexing vs. active management issue, the differences in product structure between funds and ETFs are irrelevant.

Investors often start by assuming they should buy ETFs – then look for a strategy that they like. But this is backwards.

Start instead by figuring out what you want your money to do for you. Translate that into quantifiable goals linked to time frames to help define a mix of stocks and bonds to achieve your target return. (Importantly, this should be documented in an Investment Policy Statement.)

Making sure that the risk you’re willing and able to take is consistent with that mix, your focus should shift toward defining the type of exposure to stocks and bonds that fits with your needs. Focusing on obtaining that exposure at reasonable cost will lead to the best and most suitable structure and product.

This summarizes how we design portfolios for our clients. It’s a rigorous process that will tilt the odds in favour of achieving your goals – and it should be used by all investors whether they’re disciplined enough to fly solo or require the help of a professional.

So forget about picking sides in silly debates. Focus on meeting your goals and doing so efficiently in terms of costs and risk. So don’t let the industry’s pumping out of product define what you buy. Rather build a sustainable investment strategy driven by your needs.

>> HighView Financial Group is an investment counselling firm for affluent families and foundations. We build portfolios based on the unique goals of each client. Schedule a complimentary discovery session to see if we’re the right investment stewardship counsellors for you.

You may also be interested in:

Some Advisors Behaving Badly with CRM2 on the Horizon

Monday, March 16th, 2015

CRM 2After mid-July 2016, CRM2 will require investment dealers to report personalized performance, charges and commissions annually to each client. To their credit, many dealers are now providing performance reports.

But two disturbing trends are brewing beneath the surface in an effort to skirt the reporting of charges and commissions.

Escaping Securities Regulation

Compliance obligations of investment dealers and their individual financial advisors (i.e. registered salespeople) have ramped up over the past decade. Over that time, I’ve heard many stories of financial advisors giving up their investment licenses to focus on the sale of insurance products. Firms and individuals licensed to sell insurance are regulated by provincial insurance regulators (e.g., Financial Services Commission of Ontario or FSCO) but are out of reach of provincial securities regulators.

With July 2016 just over a year away, I’m hearing from multiple sources that an increasing number of advisors are treading down this path to escape the enhanced reporting of performance and costs. As this rule kicks in for all advisors regulated by securities regulators, insurance-only advisors will be Teflon as far as CRM2 is concerned.

Churning Ahead of Commission Reports

In a similar effort to minimize the impact of CRM2’s cost reporting component, many advisors are initiating dubiously-clever transactions. CRM2’s cost report will show a list of amounts charged directly to clients and commissions received on behalf of the client’s investments. But this only starts after mid-July 2016 – which means that the first report won’t be issued to clients until 2017.

In the meantime, I’m told by a variety of sources that many advisors are pushing through what’s been described to me as “a boatload” of mutual fund sales under a deferred sales charge (DSC) option. When an advisor sells a mutual fund on a front-end load (FEL) basis, she generally receives no up-front commission payment and an ongoing trailing commission of 0.5% to 1% per year based on the value of the investment. (Commissions are paid to the dealer, of which 25% to 100% is paid to the individual advisor).

Clients investing in a DSC fund trigger a bigger up-front commission – i.e. usually 4% to 5% of the value of the investment – plus a trailing commission of 0.25% to 0.50% per year. So advisors who are able to sell a pile of DSC funds will be paid significant up-front commissions prior to 2016 – which won’t show up on any cost and commission report because it’s not currently required.

And by the time that cost reporting is a requirement, the clients of advisors that rushed through its DSC sales will only see a trailing commission amount that is half the size of the more ethical advisors that use FEL funds, were paid nothing up front but are paid higher trailing commissions. The DSC commission will be excluded from the commission report if it was paid more than a year prior to the first report in 2017.

Compliance officers of dealer firms should watch for evidence of these troubling trends.

Investors should similarly watch out for advisors changing firms or recommending moving portfolios to segregated funds or other DSC mutual funds that may trigger a new set of commissions. (New DSC purchases will also have you pay a fee to exit the funds within the next 6-7 years.)

Both trends are worrying and exemplify the type of ethically-challenged advisor that gives the entire industry a bad name.

Investment Counsellors Are More Transparent

The antidote, of course, is to deal with a firm that is already held to a fiduciary standard. It has long been the norm for investment counselling firms – which are usually registered as Portfolio Managers – to be more transparent.

They tend to deal with higher net worth clients, who are more sophisticated and demand greater transparency. In response, most investment counselling firms have been providing this in the absence of a legal requirement. But then being held to a fiduciary standard creates a different mindset with respect to transparency.

So it’s no wonder that securities regulators continue to study whether to impose this standard on all advisors under their jurisdiction. Let’s just hope that securities regulators are able to persuade their insurance counterparts to hold insurance-only licensed advisors to higher standards.

(See this February 2015 Globe and Mail article and an older piece from July 2011 on the merits of hiring an investment counsellor.)

>> HighView Financial Group is an investment counselling firm that takes a fiduciary approach to affluent family and foundation wealth. We are transparent and accountable in all that we do. Schedule a complimentary discovery session to see if we’re the right investment stewardship counsellors for you.

You may also be interested in:

Go global instead of slicing & dicing your stocks by region

Tuesday, December 23rd, 2014

In a recent article, Globe and Mail columnist Rob Carrick tackled the important issue of global stock diversification.  He surveyed several investment advisors and portfolio managers for their recommended allocations between Canadian and non-Canadian stocks.  Carrick makes many good points – e.g., reminding readers of past investor mis-behaviours and how current fund flows could be repeating those past mistakes.  But I was surprised at the experts’ suggestions.

To be fair asset allocation across and within asset classes is very much a blend of art and science.  But I expected at least one expert to avoid the typical Canada, U.S. and International stand-alone slices for stock exposure.  Splitting stocks between Canada and global mandates (with developed and emerging markets included in global) makes the most sense to me regardless of whether you’re an advocate of indexing or active management.

Indexing disciples should follow Carrick’s idea of simply allocating 4% of your stocks to Canada to reflect our share of global stock markets by current market value.  This is the truest form of the theory underlying indexing.  Funds like Vanguard’s Total World Stock Market ETF (VT/NYSEArca) include the entire world – i.e. Canada and the rest of the world; developed and emerging markets – making it a great cheap once-decision fund to cover the world’s stocks.

(A similar Vanguard ETF excluding Canada trades on the TSX which may be preferable when paired with Canadian exposure for wealthy individuals and for TFSA accounts.)

This approach can be more tax-efficient – e.g., realized losses on emerging markets stocks are offset by gains in U.S. stocks – and can help avoid the many pitfalls of buying narrow slices of financial markets.  I’ve seen countless examples of investors using ETFs because of the appeal of indexing – only to end up making active bets and paying the price in the form of poor performance.  Besides, if you buy into the theory of indexing you have no basis for believing that your active bets can add value.

Advocates of active management should also favour global funds rather than slicing up the world using country and regional funds.  If you choose an active manager, you should want the skilled manager to have more flexibility – not less.  In other words, the best mandate is a global mandate that includes emerging markets and is not tied down by any other rigid constraints.

Sure you might have to take a pass on your favourite U.S. or European manager because they lack global specialty.  But advisors and investors are too prone to making the wrong active bets on this country or that region.  Deciding on the geographic make-up of your non-Canadian stocks is better left to a skilled global manager than the end investor or financial advisor.  I include my self and our firm in that statement.

Astute readers might recall that I was asked how I planned to invest my annual TFSA contribution in early 2012 .  My reply:  divide it between a U.S. ETF and an overseas stock fund.  But as I explained in a related blog post, blending active and passive approaches is the one scenario where it can make sense to depart from my ‘global’ advice.  I was willing to accept what I viewed as a sub-optimal geographic allocation to benefit from significant cost savings.

So resist the urge to slice and dice the world into several pieces.  It usually leads to destructive mis-behaviour and fails to fully exploit skilled active managers.  Instead, aim for broader exposure to give yourself – or your clients – the best chance of investment success.

CalPERS’ hedge fund decision offers important lessons

Friday, September 26th, 2014

The California Public Employees’ Retirement System – aka CalPERS – announced plans to liquidate its $4 billion hedge fund portfolio.  It’s big news because CalPERS is considered a well-run pension plan.  It’s huge – at nearly $300 billion USD – and it was one of the first pension plans to invest in hedge funds.  Investors and advisors could learn a thing or two from CalPERS’ latest decision.

Scale

CalPERS interim Chief Investment Officer Ted Eliopoulos said in a recent Bloomberg interview that a key factor in its decision was its inability to add enough money to maintain a meaningful hedge fund stake.  For example, in mid-2002 CalPERS’ portfolio was $142 billion – of which $6.6 billion – or 4.6% – was invested in more than 200 hedge funds.

Eliopoulos said that CalPERS’ hedge fund investments make up just over 1% of the plan’s $300 billion.  CalPERS’ hedge fund allocation has been under review for a few years but it makes sense that spreading such a small percentage of the portfolio across hundreds of hedge funds would not have a meaningful impact on the fund’s diversification or returns.  But a dozen years ago the fund had almost $7 billion in hedge funds.  Now it’s $4 billion.  So they’ve already been actively pulling money out of hedge funds.  And the other two reasons given by Eliopoulos – cost and complexity – are likely the bigger factors at play.

Cost

CalPERS’ Statement of Investment Policy for Investment Beliefs lists ten ‘beliefs’ that guide the fund’s decisions.  Belief number VIII is:  Costs matter and need to be effectively managed.  During the above interview, Eliopoulos said that CalPERS’ equity management cost them just 1 basis point or 0.01% of equity assets.  Their bonds cost 0.07% annually.  This is a function of CalPERS’ size and cost-sensitivity.

CalPERS was able to negotiate lower-than-usual fees for most hedge funds but fees still amounted to $135 million last year – or about 3% of its $4 billion stake.  And this takes a huge slice out of hedge fund returns.  Yet hedge funds are alluring.

The promise of making money when stocks are down; the notion that it’s how the wealthy invest to get richer; and the indication that in the past stock-like returns were achieved with bond-like risk all make us want to try to capture some of these unique benefits.  But the costs are often higher than most realize.

Percentage fees are levied on gross assets (not net equity).  So using leverage increases total dollars paid in fees.  Borrowing costs incurred in short selling and other operating expenses also drive up costs.  And when expressing total fees and expenses as a percentage of net assets invested, all-in fees commonly fall in the high-single-digit or low-double-digit range.

Complexity

Retail investors have learned the hard way about the dangers of complexity risk.  You can’t form realistic risk and return expectations if you don’t fully understand the product.  With hedge funds complexity is observed in product structures, strategies employed and the general lack of transparency.  CalPERS’ investment belief number VII reads:  CalPERS will take risk only where we have a strong belief we will be rewarded for it.

Investments involving leverage, high costs and complexity typically involve higher risk – and a lower chance for adequate rewards.  Compounding this challenge is the notion of a crowded trade.  With stock investors having experienced two bear markets in the 2000s, many sought so-called ‘uncorrelated’ strategies to boost risk-adjusted returns.  And with significant inflows that have pushed assets well north of $2 trillion, hedge funds are a crowded field chasing a shrinking amount of excess returns.

One of our firm’s core beliefs – and it is the first on CalPERS’ list – is to construct investment portfolios by matching assets with future spending liabilities.  Tom Bradley wrote in a recent blog post – What’s wrong with vanilla? – that investment portfolios’ core still belongs in traditional stocks and bonds.  And these are the building blocks for achieving this asset-liability match.  Meaningful but limited exposure to alternatives – e.g., real estate – can make sense so long as the fundamentals are well understood.  Otherwise, the bulk of the portfolio should be pretty much plain vanilla.

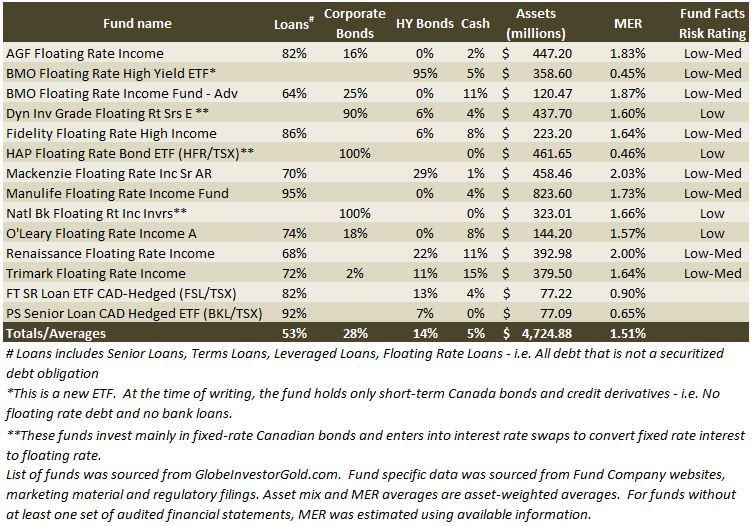
Illiquidity may be floating rate funds’ biggest risk

Wednesday, July 30th, 2014

Floating Rate Debt (FRD) is getting an increasing amount of attention.  Over the past year, several new products have been launched focusing on floating rate debt such as leveraged loans and so-called senior loans.  All pay floating rates of interest – a feature that is too heavily promoted for my liking – while offering juicy yields to entice investors.  The marketing of such funds is misleading in my view.

The industry boasts loudly about how such funds can protect investors from rising yields.  While there is little mention of downside risk potential, at least most are up front about the credit risk profile of floating rate and senior loan funds.  But funds with large holdings in bank loans face a potential liquidity risk that usually gets nothing more than a passing mention – if anything at all.  And that’s a practice that needs to change before the next credit market meltdown.

Settlement Terms:  bonds vs. loans

Key to understanding the liquidity risk is understanding the differences in how loans are traded and how that differs from bonds (i.e. securitized debt instruments or fixed income securities).  Settlement terms refer to how long before buyers must pay for their purchased investments and when sellers are entitled to proceeds from the investments they’re selling.  Stocks and bonds settle on T+3 settlement terms.  For instance, if you sell a bond on Monday, the proceeds are added to your cash by Thursday (i.e. three business days after the date the trade is filled).

Bank loans can settle as quickly as T+5 or as long as T+40 according to page 4 of this BlackRock presentation on floating rate notes and bank loans.  To put that into perspective, 5 business days equates to a full calendar week (assuming no holidays).  Forty business days is about two months on the calendar.

Bonds, debentures and notes settle on T+3 terms – the same terms applicable to mutual funds, ETFs and other exchange-traded securities.  But according to a recent Bloomberg article, bank loan trading requires the involvement of lawyers and clerks to review and vet documents for every trade.  The liquidity risk stems from a mismatch of placing these relatively illiquid loans inside of a legal structure that is very liquid.

In the extreme cases of direct property, labour sponsored funds and other illiquid investments investors could end up making an unintended lifetime commitment.

(Mis)truth in labelling

Holdings labels are vastly different between website profiles, Fund Facts disclosure documents and financial statements.  In some cases fund holdings are lumped into rather generic “corporate debt” label.  Sometimes moving to Fund Facts provides more detail in terms of how much is held in term loans and how much is in more liquid bonds.  At other times, only published financials have proper holdings classifications.  And this needs to be improved.  Take Trimark Floating Rate Income, one of the oldest funds, for example.

Its website shows a geographic breakdown only.  The top holdings list indicates that this fund may hold a bunch of loans – not more liquid bonds.  The fund’s monthly profile and Fund Facts document each shows a big allocation to “floating rate debt” but neither breaks out how much is in bonds vs. loans.  It’s not until I pop open the financial statements that I see a real breakdown of bonds vs. loans.  I feel for the individual investor because this is representative of this group of funds – not an isolated case.  What’s striking is how clear and easy the same firm makes this exercise for its TSX-traded Senior Loan ETF.

I should highlight the O’Leary Floating Rate Fund’s prospectus for being better than most in speaking to liquidity risk; specifying that its holdings could see settlement terms as long as T+19 when buying or selling loans.  I have in the past directed well-deserved and sharp criticism at the firm (e.g., for its aggressive marketing, for talking up its book, etc.).  But on this issue they deserve kudos.

Floating rate fund asset mix

In the table below (click to enlarge it) I’ve attempted to present a clearer picture of how much each floating rate or loan fund holds in bonds and bank loans.  A few funds boast low credit risks and good liquidity.  The other ten funds are stuffed with less liquid bank loans.  I hope that the below table will help those who are so focused on protecting against rising rates become more aware of the liquidity risks they’re assuming in exchange.

WS_FloatingRateFunds_AssetMix

See also…

Industry risk rating failing investors of floating rate funds (The Wealth Steward)

Fixed Income’s new reality (Tom Bradley, Steadyhand Investments)

Expect more distribution cuts from monthly income funds

Wednesday, July 9th, 2014

I have been writing about Monthly Income funds for more than a dozen years.  In my 20-year career, none of my articles or comments have generated as much feedback (or as much anger) as my critiques of Monthly Income funds.  Capital market activity has made distributions less sustainable than they were a year ago.  Many funds have quietly reduced distributions while others have been more forthcoming about distribution cuts.  And if we hit even a mild bear market for stocks – which could take a year or two to materialize – more cuts are in the cards.

Two years ago I wrote about my expectation for balanced portfolios to generate 6.5% annually over the subsequent 10 years.  Back then, stocks and bond were cheaper – making prospective return potential higher than today.  Stocks are currently priced to generate 7-ish percent long-term annualized returns (before fees, taxes, impact of cash flow timing and value added/detracted) while bonds yield 2.4% annually.  Accordingly, balanced portfolios are unlikely to punch out total returns of more than 5% annually based on our recent calculations (again before fees, taxes, etc.).

This is relevant because most of the Monthly Income funds I’ve reviewed have some kind of balanced asset mix policy.  A review of appropriate distribution levels is a routine exercise at many fund companies.  For instance, IA Clarington Strategic Income Y (the original Clarington Canadian Income fund – the subject of my first article on this topic) switched to a variable distribution rate starting last month.  After spending most of its life over-distributing – and grinding its unit price to half of its initial 1996 level – the fund has finally transitioned to simply paying out its taxable income.

Another example is NEI Northwest Growth & Income A – which spent years paying out $0.96 per unit each year (i.e. $0.08 monthly per unit).  It cut payouts to $0.06 monthly per unit for 2012; and then last year did away with its level monthly cash payout.

There are certainly examples of responsible and sustainable distribution policies.  Examples include TD Monthly Income, RBC Monthly Income, Steadyhand Income (which gets top marks for proactive communication) and more recently BMO Global Monthly Income.  Some may recall my critique of BMO for both of its domestic and global Monthly Income funds among others.  BMO Global Monthly Income’s distribution sustainability is much improved.  Unlike others, it didn’t cut its payout.  Rather it has seen a sharp increase in its allocation to stocks – from about 56% several months ago to nearly 70% recently – which raises its risk but also increases its total return potential.

Investors beware.  Most of the funds I’ve seen sporting sustainable distributions have sibling funds or similar products with distributions that cannot be sustained in my opinion.  While the I and A series units of TD Monthly Income offer very sustainable cash payouts, the same fund’s series-T units pay out too much in my opinion.  Similarly, RBC Monthly Income has long had a responsible distribution policy.  But RBC Managed Payout Solution – Enhanced Plus needs to cut its distribution in half to be sustainable by my estimate.

Investors and advisors should understand the extent of a fund’s sustainability, stay on top of distribution changes and keep an eye on those ramping up risk exposure to juice returns to support monthly payouts.  Skinny bond yields and fully valued stocks will restrain total returns going forward; which will put more pressure on Monthly Income funds to take action to keep cash flowing.

Fund risk rating change highlights need for reform

Friday, April 4th, 2014

I have written many times over the past several years about the shortcomings of the prevailing method of assessing and communicating risk to mutual fund investors.  It’s a non issue for HighView’s business so I’m careful not to spend much time on the issue.  But I felt strongly enough about this to make a personal submission to regulators to share my thoughts on this important issue.  A recent change to one popular fund’s risk rating simply confirms the weakness of the current risk rating method and the need for legislated meaningful risk measures.

Prevailing risk rating method

The vast majority of fund companies in Canada use the risk rating guidelines designed by the Investment Funds Institute of Canada (IFIC).  The paper describing the method in detail was never made public until recently when IFIC submitted its comments to regulators on this issue (starting on page 19 of IFIC’s submission).  A summary of IFIC’s approach is to calculate 3- and 5- year standard deviations and applying the results to a five-point scale tied to descriptive labels – i.e. low, low-medium, medium, medium-high and high – used in prospectus and Fund Facts disclosure documents.

Fund companies are don’t have to use this method.  But even if they do, they can exercise discretion to deviate from IFIC’s guidance.  While IFIC recommends documenting the rationale for deviating from the guideline, this is not a requirement.  New funds can simply use the standard deviation of a benchmark or its category as a proxy.  IFIC recommends reviewing all risk ratings annually.

PIMCO Monthly Income

PIMCO Canada Corp recently lowered the risk rating of its popular PIMCO Monthly Income fund from ‘low-medium’ to ‘low’.  This likely resulted from the fund recently hitting its three year anniversary – allowing it to use its short but strong track record to calculate risk. This flexible fixed income fund is an ideal mandate for PIMCO to flex its active management muscle.  It’s worked well so far judging by the fund’s strong performance and its fees are very competitive to boot.

I haven’t done due diligence on this product but there appears to be a lot to like.  While I understand the IFIC method I don’t understand how risk goes down after a string of strong returns in a period that has not seen even a mild bond bear market.  While there are no strict constraints, this fund has so far been exposed to higher credit risk.

As of mid-2013, more than 60% of the fund’s holdings in debt and other obligations rated below BBB.  See page 72 of the fund’s June 2013 semi-annual report for this credit risk breakdown. It uses a number of derivative instruments including currency and interest rate swaps.  Aside from the counterparty risk this involves, there is the risk of being wrong.

The fund ordinarily takes short positions – albeit modest ones – and uses credit default swaps (bets that companies will default).  Finally, the portfolio is heavily traded.  In its first 2.5 years, this fund’s turnover has averaged 380% annually – meaning that its dollar weighted average holding period for investments has so far been about as long as a university semester.

Any investment that has generated strong double-digit returns should not be considered ‘low risk’.  This misleads investors into thinking that low risk and high return is a reasonable expectation.  More importantly, the rating doesn’t adequately inform investors about the risks that lie ahead during the next credit market freeze or when the PIMCO managers show their humanity and get some of their bets wrong.

PIMCO is following the rules.  But assessing this as a low risk fund simply shows the inadequacy of the status quo that so many fund companies have argued to maintain.

PIMCO Global Income Opportunities: enthusiasm vs reality

Thursday, March 27th, 2014

Tom Bradley just posted a smart analysis of a new closed-end fund.  PIMCO’s newly-launched Global Opportunities Income fund attracted $600 million – the top end of its target.  That’s a very warm reception to say the least.  I won’t repeat Tom’s excellent analysis but would like to expand on a couple of points he made.

Higher return = higher potential risk

The fund is targeting a distribution equal to 6.5% of the initial value of the fund.  The prospectus highlights that the portfolio they’ve designed for this fund boasts a recent yield of 7.2% per year.

With GIC rates and government bond yields so low, too many investors assume that managers like PIMCO – considered an elite bond manager – can achieve high returns without exposing investors to higher risk.  As I stated at the MFDA’s Seniors Summit last September – coincidentally on a panel with Tom – investors and advisors must assume that higher potential risk always accompanies the potential for higher returns.

With 7- and 10- year Canada bonds yielding 2% and 2.5% per year respectively anything offering a gross yield north of 7% must – by definition – have significantly higher risk potential than those guaranteed options.  The benefits of an offering like this will be obvious but you’ll have to dig a little to uncover the true associated risk factors.

Leverage & fees

Tom notes that the fund’s 1.25% management fee is charged not on the net asset value but on the total – or ‘gross – asset value.  For most funds this is little difference between these two descriptions.  But it’s an important distinction for a fund employing leverage – i.e. borrowing money to increase total investment assets.

The fund will initially employ leverage equal to 25% of total assets, which equals 1/3rd of the initial net proceeds raised.  But management expense ratios are computed on net assets.  So charging a 1.25% fee on total assets with 25% leverage equates to a management fee of 1.88% including HST.  With its maximum leverage of 1/3, the management fee would be 2.12% including HST on the fund’s NAV.

These figures exclude interest costs from borrowed funds, which could push the fund’s management expense ratio toward 3% annually or higher depending on how much leverage is employed and how long it is maintained.

PIMCO_GlobalIncomeOpps_Leverage_Fees

IPO investors starting deep in the hole

I’m not a fan of buying a closed-end fund at IPO because the most eager investors effectively shoulder all of the costs of listing the fund on the stock exchange.  IPO investors ponied up $600 million, out of which they paid $30.2 million in issuance costs.  Investors, then, start more than 5% under water out of the gate.  Factor in fees and taxes and the fund must generate a total return of 7.2% in year 1 – gross of fees – to get back to square one.

Extending the above calculation, I also find that the fund’s distribution policy – i.e. 6.5% of the initial net proceeds – requires a total return of 13.7% in year one (gross of fees) to cover the issuance costs and the cash distribution.  After year one, the fund will need to sustain a minimum total return of 8.4% per year before fees to sustain the distribution longer-term without eroding the unit price.

PIMCO_GlobalIncomeOpps_ReturnTargets

While these return thresholds are calculated gross of fees, they don’t take into account the impact of interest costs – which bumps up fees.  While the fund’s U.S. cousin – PIMCO Dynamic Income – has generated strong USD returns, this was achieved by taking risk that will materialize the next time credit markets hit a soft patch.

Perhaps this will be a fine investment.  But if you invest for yourself or recommend it to clients, make sure you flesh out the above issues and other relevant risks in much greater detail.