Archive for the ‘Uncategorised’ Category

Think Twice before Replacing Your “Risky” Bonds with “Safe” Stocks

Tuesday, April 11th, 2017

Think Twice before Replacing Your “Risky” Bonds with “Safe” StocksFor virtually my entire career, bond yields have been characterized as “historically low” – yet have fallen with few interruptions. Since the Financial Crisis, however, yields have been super skinny and have continued falling. Razor thin yields challenge traditional balanced portfolios (which I wrote about in this 2012 blog post). So many are dumping some or all of their bonds for higher-yielding and higher-returning investments.

But investors have been adding this extra yield (and total return) in exchange for increased exposure to stocks and treating them as bond replacements because of the associated income. Many have enjoyed the upside of this strategy but are likely unaware of the risk this involves.

When (not if) the next bear market occurs, don’t expect these riskier bond replacements to offer any protection. Here are some popular investments or strategies that many have used as bond substitutes:

Dividend-Paying Stocks and REITs

The lure of equities paying a “steady stream of growing income” is understandable. Real estate investment trusts (REITs) and dividend-paying stocks offer attractive yields and the potential for rising payouts.

But there are three problems with using them to replace bonds:

  1. In bear markets, both dividend-paying stocks and REITs are likely to suffer as much as the broader stock market. They almost never protect against bear markets because they’re likely to get swept up in the doom-and-gloom just like other stocks. *See the accompanying table for some selected supporting statistics.
  2. While both dividend-payers and REITs have outperformed broader markets over the past 20 years, the tailwind of falling interest rates has been a big factor. I expect that they’ll perform fine in the face of rising rates but the extra return potential of the past is far from a sure thing in the future.
  3. Investors assume that they’ll be able to hold onto their income-producing equities better than other stocks because of the continued income flow. If dividends are paid in cash (i.e. not reinvested) price declines will be even steeper in bear markets than many realize. Take the S&P/TSX Capped REIT Index as an example.

The returns shown in the below table are total returns – i.e. they assume that all dividends are fully reinvested in the same index. And when dividends are not reinvested, the share price decline is more severe in bear markets. The table shows that the REIT Index dropped by 51.5% on a total return basis during the last bear market. But investors taking the dividends in cash would have seen the price drop by more than 62% over 2+ years.

Think of watching your “capital” drop for two years; seeing every dollar drop to less than 38 cents. How do you know that it won’t drop further? How do you stop yourself from selling out of fear that it will keep falling? The REIT index took more than 4 additional years for the price to climb back to its previous peak. That’s more than 6 years under water. Admittedly this kind of decline doesn’t happen often. But it will again at some point. And when it does, it will test all but the most disciplined investors.

The table below shows risk and return statistics for three types of Canadian equities – alongside HighView’s 60/40 balanced portfolio model. Our balanced model shows a significantly lower total return compared to being 100% invested in stocks – not surprising given that it’s 40% invested in bonds. But some of our model’s solid risk and return stats are also attributable to our selection of managers and the design of the mandates used to build client portfolios.


Nov-2002 through Feb-2017 Canadian Stocks Canadian Dividend Payers / Income Trusts Canadian REITs HighView 60/40 Balanced Portfolio Model
Annualized Return 9.3% 11.6% 10.6% 7.3%
Best Year 47.6% 66.0% 75.6% 25.8%
Worst Year –38.2% –36.0% –39.9% –13.5%
% of Losing Years 23.0% 24.2% 25.5% 14.3%
Biggest Drop –43.3% –46.7% –51.5% –16.7%
Time Under Water 31 months 28 months 43 months 27 months
Standard Deviation 12.3% 14.0% 14.1% 7.2%

*Please see the important disclaimer at the bottom of this post.

Covered-Call Strategies

Holding stocks and selling options against those stocks is another strategy some investors use to replace the income they once received from bonds. But this is even worse than income-paying equities since the strategy offers more exposure to the market’s down moves than it does when the market is leaping higher. (See this September 2012 blog post for more on this strategy.)

Bonds Have a Role to Play

We build portfolios for clients using building blocks made up of exposure to stocks, bonds, cash, and private market assets. Each building block has a defined purpose or role to play in pushing clients closer to their goals over time. While we expect stocks to outperform bonds over the next decade; even low-yielding bonds have a role to play.

They offer clients a stable – albeit low – income stream. Bonds also offer stability since they tend to perform well when stocks fall hard. And that makes them a source of cash to rebalance when it’s most important. So if you’re looking for alternatives to your bonds, make sure your decisions are made in this kind of purpose-driven context.


HighView is an experienced investment counselling firm for affluent Canadian families and foundations. Schedule a complimentary discovery session to see if we’re the right team for you.

Watch our video: “Legitimate Yield… or a Mirage of Cash Flow”.

You may also be interested in:

Disclaimer

HighView Financial Group is a brand name used by HighView Asset Management Ltd. (“HighView”). HighView is an experienced boutique investment counselling firm, dedicated to developing sustainable wealth solutions customized to our clients’ specific needs and goals. HighView is registered in Ontario, British Columbia, Alberta and Saskatchewan in the category of Portfolio Manager.

Unless otherwise noted, portfolio performance is for periods ending February 28, 2017 using quarterly returns and are net of expected management, advisory, custody fees and applicable taxes unless otherwise noted. Highs and lows would be more extreme using daily weekly or monthly returns rather than quarterly. Mawer Canadian Equity’s performance reflects the performance of our original choice for this mandate – Dynamic Value Fund of Canada – and after April 10, 2012 the actual returns of Mawer Canadian Equity. After August 2014, Laurus Enterprise Small Cap returns are from that fund. Returns from April 2011 through August 2014 are from Dixon Mitchell Small Cap fund. Previous returns are from Trimark Canadian Small Companies fund. Guardian Global Dividend Growth returns after September 2011 are calculated from a HighView model account. Prior returns are from Guardian’s composite for this strategy (Jan/07 – Sep/11) and Guardian’s Global Equity composite (before 2003-07) and low-cost global equity index funds (net of respective index fund fees). Mawer Global Small Cap returns begin in November 2007.

Prior returns for this fund are from its benchmark, Russell Global Small Cap TR CAD Index to provide a fuller portfolio historical illustration. Returns of HighView’s Canadian Bond mandate are from laddered bond ETFs (60% CBH/TSX + 40% CLG/TSX) after August 2012 and from Beutel Goodman Income previous to September 2012; which is how this mandate was invested starting in April 2010. Returns for Canso Broad Corporate Bond Pool used in this illustration are actual product returns but this only became a HighView mandate on April 1, 2010; so all prior returns are used for illustrative purposes. Commercial Real estate was originally invested in KingSett Canadian Real Estate Income Fund LP. Returns from October 1, 2008 through the date of this illustration are actual returns. We backfill returns prior to October 2008 with returns of this mandate’s benchmark to allow longer-term illustrations. KingSett was selected for this mandate by April 1, 2010. KingSett has not accepted new investments since 2012. LP financial statements are available approximately 60 days after each calendar quarter. For periods where total returns cannot be confirmed with financials, we assume that total return is made up only of distributions, which are known quarterly in advance. When NAV changes are confirmed, performance will be revised retroactively when financials are available to reflect accurate total returns. Private Debt is a notional mandate made up of four distinct strategies investing in four private market investment products. It became a HighView mandate on October 1st, 2015. Prior performance is hypothetical and assumes a fixed 7% annualized return as a proxy. Private debt involves liquidity, credit and equity risk. Volatility would be higher if the mandate held publicly traded securities. All other mandate and manager returns are from the actual mandates or products listed.

Raw data sources: Sub-Advisers, BlackRock Inc, MSCI, Morningstar Research Inc., Vanguard, Yahoo! Finance, Bank of Canada. All returns for the HighView model portfolio prior to April 2010 are back-tested data; and contain hindsight bias and are shown for illustration purposes only but based on actual fund, manager and index performance.

Concerns with “Fund Facts” and “ETF Facts” Risk Ratings

Friday, January 6th, 2017

shutterstock_498521737-1-300x200

“Fund Facts” is a 2 to 4 page regulatory summary document designed to inform investors on a mutual fund’s salient features. A version for exchange-traded funds – i.e. ETF Facts – will be required starting next September. One of the most important aspects of Fund Facts and ETF Facts is its “how risky is it?” section. While the Canadian Securities Administrators (CSA) recently took the good step of creating a uniform standard, its risk rating method is unlikely to better inform or protect investors in my opinion.

Fund Facts and ETF Facts show risk on a five-point scale ranging from “low” to “high”. Product sponsors will calculate each fund’s standard deviation (SD) – which measures how widely a fund’s returns bounce around its monthly average – and map the number to one of the five risk labels. Unfortunately, this simple-sounding method doesn’t tell investors anything about how much they could lose or how long they should hold a fund to minimize the chance of loss.

Nine years ago, in my first column for Investment Executive (an industry publication), I urged regulators to adopt a simpler and more practical forward-looking approach that communicated to investors that stocks had lost half of their value in past bear markets and that this would eventually repeat in the future. By contract, Fund Facts typically rated stock funds as “medium risk” back then (as now).

shutterstock_521591350-300x200Sixteen months following this column, stock markets around the world had declined by 40% to 60%. Investors who were told that stocks would occasionally be cut in half were better prepared for the Financial Crisis compared to those relying on labels like “medium risk”. That was the ultimate test of Fund Facts’ risk rating and it failed miserably in my view.

The next test is how ratings have changed. There is every reason to believe that bear markets will continue to occur in the future. So the risk of bear markets – and the associated losses – does not diminish over time. On the contrary, as stock and bond prices keep rising one could argue that risk increases. And yet investment fund risk ratings (found on Fund Facts) have overwhelmingly been reduced.

Tracking Mutual Fund and ETF Risk Ratings

Over the past two years, I tracked risk rating changes for nearly 100 unique mutual funds and ETFs. 77% of those funds saw risk ratings reduced despite the fact that we’re nearly 8 years into one of the longest bull markets in history for stocks and bonds.

Of the funds tracked, 57 have enough history to have experienced at least one bear market. The 14 funds sporting their new “low risk” ratings lost an average of 20% in the last bear market – spending more than 2.5 years under water. 20 funds of those funds now fall into the “medium risk” bucket. Those funds lost 43% on average in the last bear market, spending more than 6 years under water.

I’d wager that few investors would equate low and medium risk with those downside risk numbers. The table below summarizes data on all 57 funds I tracked that are old enough to have bear market data:

highview

Specific Examples

Take Manulife Global Real Estate as an example of how this risk rating method is failing investors. On August 1, 2014 its risk was reduced from “high” to “medium-to-high”. Less than a year later, this fund’s risk rating was cut again to “medium”. What had changed in less than a year to see its risk rating move from “high” to “medium”? When times are good and prices are rising, volatility (or standard deviation) tends to fall. As SD falls, its risk rating – according to the current and new rating method – has a good chance of falling. Yet this fund lost 42% in the last bear market and spent 3 years recovering.

MD American Growth is another, more striking example. This past May, its risk rating was dropped from “medium-to-high” to “medium”. From August 2000 through March 2003 this fund lost 55% of its value. It rose less than 20% in the subsequent four years – still far from recovery. That’s when the Financial Crisis started – a lengthy decline that clipped another 41% off of its value.

That’s a peak-to-bottom loss of 68%. And as of November 30, 2016 it’s still a few percentage points below its peak in August 2000 – more than 16 years ago. The CSA’s new risk rating method would keep this firmly in the medium risk bucket, despite losing more than 2/3rds of its value and only now inching back toward its peak from more than 16 years ago.

Final Thoughts

As professionals working directly with – and held accountable to – our clients, we take the measurement and communication of risk very seriously. While I don’t doubt regulators’ intent, this risk rating method makes no sense to me. More importantly, I highly doubt that this will make much sense to the very people this rule was designed to protect and inform.


HighView is an experienced investment counselling firm for affluent Canadian families and foundations. Schedule a complimentary discovery session to see if we’re the right team for you.

You may also be interested in:

Regulations Will Create Scalability Challenges for Canadian Robo-advisors

Friday, November 18th, 2016

Regulations Will Create Scalability Challenges for Canadian Robo-advisorsRobo-advisors offer investment advice through websites and mobile applications. In the U.S. this segment – which was born after the Financial Crisis – manages tens of billions of dollars for clients. American robo-advisors can provide investment advice with minimal personal contact. And while they are Registered Investment Advisers, they have the ability to opt-out of their fiduciary obligations according to an updated SEC policy document.

Regulatory filings (see its Form ADV) for Betterment LLC – the largest U.S. robo-advisor – show that it manages $5 billion in assets on behalf of 130,000 clients. That’s an average of about $38,000 per client. It employs 136 people – of which only 8 are registered to give investment advice and another 7 are licensed salespeople. So Betterment’s 15 licensed employees serve nearly 9,000 clients each. The typical client, then, has little or no contact with a licensed investment adviser or salesperson. This is what’s known as scalability – i.e. the ability to add clients without adding employees and systems.

Robo-advisors in Canada

In Canada, robo-advisors must register as Portfolio Managers, which cannot opt-out of their legal fiduciary duty. In my column for the September 2016 issue of Investment Executive, I explain why this will limit the scalability of Canadian robo-advisors’ businesses. If they grow as planned, they will need tens of thousands of clients to succeed financially. Technology infrastructure can be built to easily handle this volume. But obligations of registered Portfolio Managers will also require a significant hiring of people who can speak with clients about their investments – and that limits scalability by adding to costs.

Wealthsimple is the only Canadian robo-advisor has released business milestones. The October 2016 issue of Report On Business magazine notes that Wealthsimple – which calls itself Canada’s largest robo-advisor – has 20,000 clients investing an average of $25,000 each. It has 5 registered individuals. I’m not privy to Wealthsimple’s plans, but they could need dozens to be able to spend the time needed to have a “meaningful discussion” with each client to gather sufficient information in order to make sure recommendations are suitable. This is the minimum regulatory requirement for all registered Portfolio Managers – robo or otherwise.

One could argue that investor-clients needn’t care about the business side of robo-advisors so long as they deliver good advice and service. But if a business is, at best, experiencing growing pains or – worse – struggling to make a profit, it can affect both the quality of advice and service.

Robo-advisors are a great innovation so I hope that they can all find a workable solution to adhere to the rules while still making it worthwhile to serve clients of all sizes (particularly those with less than $250,000). Investors will need robo-advisors to find this balance to fill the gap that will be created by new regulations and industry competitive forces.


HighView Financial Group is an investment counselling firm for affluent families and foundations. We build portfolios based on the unique goals of each client. Schedule a complimentary discovery session to see if we’re the right investment stewardship counsellors for you.

You may also be interested in:

Making Sense of Your New CRM2 Performance Report

Wednesday, September 14th, 2016

seo-1603927_960_720-300x169Client Relationship Management (CRM2) became official. CRM2 is a new set of rules requiring most “financial advisors” to provide two new annual reports to each client – one detailing amounts paid to advisory firms and another detailing performance. The performance report will show your investment accounts’ percentage returns.

The following are important things to know when reviewing your CRM2 performance report:

Timing

Some firms’ recent statements are starting to show performance. But since most people like calendar year reporting, many firms will probably send the first round of CRM2 reports during the first part of next year.

Firms that scatter client reviews throughout the year will likely start sending their first performance reports very soon. The latest you can receive your first performance report is July 15, 2017.

Rates of Return

Rates of return that you see advertised for investments are calculated using a method called “time-weighted rate of return” (TWRR).

Below is a screenshot from a GlobeInvestor fund profile that shows, for example, that this fund generated an average compounded return of 15% per year for the two years through July 31, 2016. That is the fund’s TWRR return.

returns

The only way an investor in that fund could have experienced that precise return is, for example, to have invested $10,000 in this fund on July 31, 2014, to have held it through July 31, 2016, and have done no buying or selling in the interim. In this case the value would have been $13,222 on July 31, 2016 (i.e. 15% per year).

But in the more common scenario goes something like this:

  • buy $3,000 on July 31, 2014;
  • buy $3,000 on February 18, 2015;
  • buy $4,000 on February 29, 2016;
  • hold through July 2016.

In this scenario, the same amount of money was invested in total but it was added throughout the two-year period – not all at the start. In this case, the ending value is $11,718 – and the CRM2 performance report would list the personalized return as 12.92% per year for the same two-years. It accounts for the fact that the initial $3k was invested for two years, the second $3k was invested for 17 months, and the final $4k instalment was invested for only five months.

This personalized number is referred to as a “dollar-weighted rate of return” (DWRR) because it factors in how much you buy or sell and when those transactions occur.

TWRR measures the product’s performance (i.e. not impacted by timing and amount of buys and sells). DWRR measures the investor’s performance. Most firms will simply report your personalized DWRR on your new performance reports. A minority of firms will show TWRR and DWRR.

Start Date Bias

End-date-bias is a term used to describe how measuring performance at the end of an extreme performance streak can be misleading. Examining 5-year returns, for example, at the bottom of a bear market or years into a robust bull market will not give you meaningful information.  These return measurements are biased by the extreme recent moves. CRM2 performance reports risk the opposite type of bias.

I recently heard some industry chatter that a couple of firms are choosing February 27, 2009 as their performance start date. This is very near the universal Financial Crisis low. Since then, stocks have generally doubled in value through July of this year – while bonds are up nearly 40% in total. This start date is an indication of trying to inflate performance – which is disingenuous.

Using the date the account was opened is a far more sensible approach. But an advisor I know at firm using this approach lamented that most of his clients joined him in 2007 – just before the Financial Crisis. Other firms will choose a recent start date – e.g. covering just a year or two of total returns.

I know that many of you have accounts with two or three different advisors. Differences in start dates will make comparisons tricky so keep this in mind when reviewing your performance reports.

I also encourage you to read “A nasty eye-opener – performance reports may be unsettling” in Investment Executive.


HighView Financial Group is an investment counselling firm that takes a fiduciary approach to affluent family and foundation wealth. We are transparent and accountable in all that we do. Schedule a complimentary discovery session to see if we’re the right investment stewardship counsellors for you.

You may also be interested in:

Self-Inflicted Problems: Mutual Fund Industry Has Fought Investor-Friendly Reforms

Thursday, July 21st, 2016

As seen in the May 2016 edition of Investment Executive.

finance-300x241Recently published research on mutual fund commissions’ influence on fund flows led by Douglas Cumming, finance professor at the Schulich School of Business at York University in Toronto – and the related Frequently Asked Questions document – has triggered passionate responses like nothing I have seen in my career.

The research found that commissions and “related dealers” (those affiliated with fund manufacturers) result in higher fund flows regardless of portfolio performance. The fund industry – and financial advice providers – downplayed the report, urging regulators to do more analysis before making any policy changes. Some financial advisors are under the mistaken impression that banning commissions means having to work for free.

Investor advocates want commissions – and the conflicts they create – gone. Let’s call a time out to get some perspective.

The industry created the very problem it faces. Three years ago, I wrote that the industry’s automatic “no” response to virtually every investor-friendly proposal risked bringing on the very commission ban the industry fears.

The industry also seems uninterested in facing some of its biggest worries. I spoke at the industry’s 2008 annual conference on challenges facing the industry. I focused on equity fund investors’ rate of return, which I estimated was roughly equal to returns for GICs for the 15 years through July 2008 (before the worst of the bear market). I received few questions and was never invited back.

Yet, the industry has a history of springing to action to fight investor-friendly proposals. Each time such an idea surfaces, the industry seemingly puts up roadblocks rather than making suggestions to move proposals forward.

Glorianne Stromberg’s ground-breaking papers in the 1990s were batted down for the most part – although some recommendations were implemented. The original concept paper for the fair-dealing model (FDM), started in 2000 with an Ontario Securities Commission committee, was published for comment in 2004; the FDM included a proposal to ban commissions or provide full cost transparency. Industry lobbying kicked the commission ban to the curb. The FDM was diluted before its 2009 implementation.

Ontario’s financial planning rule – seemingly poised for implementation in 2001 – was lobbied to death. The second phase of the client relationship model (CRM2) will kick in this July – more than 16 years after the initiative was born. CRM2 started as part of the FDM, but the full transparency envisioned by the FDM was watered down to CRM2’s partial cost disclosure.

The industry had many years to act as real fiduciaries toward their true clients – the end-investors. (Note that mutual fund firms are fiduciaries.) That means dealing honestly and openly with the people who trust the industry with the prudent management of their life savings.

I spent several years working for or closely with investment dealers and advisors. Commissions influence recommendations. That’s a problem, because we still have many products that pay above-market commissions. It’s not that advisors should work for free. But had the industry voluntarily implemented a transparent disclosure regime, it would have had more control over the definition of “transparency.”

Having missed that window of opportunity, rules will be forced upon the industry. And it has nobody to blame but itself.


HighView Financial Group is an investment counselling firm that takes a fiduciary approach to affluent family and foundation wealth. We are transparent and accountable in all that we do. Schedule a complimentary discovery session to see if we’re the right investment stewardship counsellors for you.

You may also be interested in:

Beware of Advertisements for F-series Investment Funds

Friday, May 27th, 2016

caution-943376_960_720-300x200Marketing is a critical component of every business, and the investment industry is no different.  But an industry trusted with the management of individuals’ life savings should be held to a higher standard.

To an extent, it is.  Regulators occasionally inspect marketing materials of portfolio managers and mutual fund sponsors.  But some ads that play by the rules still stretch and spin the truth – or mislead their target audience.  I’ve tackled this issue before in August 2014 and in March 2010.  Ads that have caught my eye more recently are more subtle.

Mutual fund performance advertisements are as old as the industry.  And in the past, claims in ads were more liberal than they are today.  Recently I’ve noticed a few fund companies advertising performance for F-series units of their funds.  Most that I’ve seen are in mainstream publications – aimed primarily at those outside of the investment industry.  This misleading in my opinion.

F-series funds were launched around the year 2000 and were designed for fee-based advisors – those who charge a fee separately for advice rather than being paid by product commissions.  F-series funds are available from financial advisors, which always involves annual fees on top of the product fees – reducing advertised performance.

So it’s a little puzzling that fund companies are promoting F-series funds primarily to people – i.e. clients of fee-based advisors – who can’t access these funds without extra annual fees.  A handful of discount investment dealers have offered F-series directly to investors since the early 2000s.  All but one of the offers are gone.

Discount broker Questrade offers clients access to F-series funds for a small per-trade cost, but they don’t advertise it.  Relatively few people know this service exists – or forget – including some fund companies whose F-series funds are listed with Questrade.  Accordingly, the vast majority of F-series investments are made by investors paying additional annual percentage fees to access these funds.

One recent ad for an equity fund’s F-series units showed an average annual compound return of 11% for the five years through March 31, 2016.  But the vast majority of those who purchased this fund five years ago (or today for that matter) had to pay an advisor separately for advice to access this product.  This separate fee is typically 1% plus GST/HST of the value of the investment – on top of the F-series fund management expense ratio – so the effective return enjoyed by most clients would have been closer to 9.8% per year.  That’s solid performance but it’s not what’s advertised.  To add insult to injury, the fine print under this ad is the standard mutual fund disclaimer – nothing specific to F-series funds and the fees that normally apply.

The industry says that promoting F-series is the new standard because it isolates the performance that the fund managers achieved.  The industry also points out that F-series is most comparable to ETFs.  In theory this is true – with one important difference.  Anybody who sees an ETF advertisement can buy the exact ETF being advertised with nothing more than nominal trading cost from any brokerage account and no extra annual fees.  Not so with F-series funds – save for one small broker that doesn’t promote F-series access.

It may be the new normal, but I still think it’s misleading to promote fund performance that is unavailable in most investment accounts.  Regulators are likely to scrutinize F-series fund ads and associated disclaimers in future rounds of marketing reviews.  These ads need to clarify the additional costs that are typically incurred to invest in these products.  And it would make more sense to show A- and F- series together in ads.  As investment fiduciaries, fund companies should be held to a higher standard than what I’m seeing in these ads.


HighView Financial Group is an investment counselling firm that takes a fiduciary approach to affluent family and foundation wealth. We are transparent and accountable in all that we do. Schedule a complimentary discovery session to see if we’re the right investment stewardship counsellors for you.

You may also be interested in:

Does Hoarding Cash Protect Investors from the Bear?

Thursday, March 31st, 2016

invest2-300x200Over the past several years, I met many investors who pulled money out of the market prior to the 2007-09 Financial Crisis. Their reasons for pulling out sounded logical.  Their profits were big while the market was low.  But these investors and others like them faced a sober reality as stock prices marched sharply higher in the face of the worries that prompted these folks to sell in the first place.

Letting economic worries dictate when and how you invest doesn’t work and isn’t sustainable.

When I last heard from these hesitant investors they were still sitting in cash.  And they’re in good company.  A recent CIBC survey concluded that Canadians’ extra cash holdings – i.e. cash that would have otherwise been invested in stock market investments – ballooned to $75 billion as of December 2015.  And CIBC noted that this stockpile – mostly built since 2012 – is still growing.  While the size of the decline in Canadian stock prices is mild by bear market standards, it’s one of the longest-lasting at more than 18 months.  That’s likely weighing on investors’ patience.

Today’s list of worries is likely longer than in 2012 or 2007.  But I can’t recall a time when there was an absence of significant macroeconomic worries overhanging the market.  In some of those years, financial markets went up.  In others they lost money.  While these investors might take credit for pulling out before a crash, I suspect this is more luck than skill.  I speak from experience.

In 1999 I was a young analyst in the midst of the most distorted market in recent history.  During the technology boom, Internet stock prices routinely skyrocketed on reports of increased website visits (not revenues or profits).  Valuations made no sense.  I avoided that craziness altogether.  And after it started unravelling – with the market already in bear market territory – I was quoted in the National Post saying that technology stocks could fall by half and still be expensive.

In hindsight, that quote turned out to be accurate but there was luck involved.  There are different drivers to every bear market.  While the 1998-2000 run up in tech stocks ignored valuations, the subsequent decline was very valuation-driven.  I am a price-sensitive analyst who happened to be in the midst of a valuation-driven bear market.  But using market valuations alone to decide when and how much to invest is unreliable – even in back testing.

Similarly, in recent years it was tempting to avoid European stocks in 2012 and 2013 when the PIIGS (to denote European countries flirting with debt defaults) acronym was popularized.  Europe was drowning in bad news while emerging market countries were expected to pull the world out of its sluggish growth phase.  Yet neither the economic trends nor the investment climate evolved as expected.

Europe topped the world’s stock markets in 2012 and 2013.  And Greece (the ‘G’ in PIIGS) was among the top performing markets.  Those emerging markets?  Well, both the economies and the stock markets of emerging markets countries have since struggled.  Similarly, when everyone was down on the U.S. in 2010 I wrote that everyone’s disdain likely made it an attractive investment.

I also met a few people in 2012 that had a windfall of cash to invest.  At that time, the market had nicely rebounded from the Financial Crisis and the strong rebound – adding valuation risk to the list of worries.  These people continued sitting on their cash windfall hoping for the next bear market so they could jump in at much lower prices.  But missing the intervening years of strongly-rising prices made these folks worse off – even after counting this year’s market decline.

A healthy economic backdrop can be a stock market tailwind but the two usually don’t go hand-in-hand in the short term.  So trying to invest based on headlines and fear doesn’t work.  The best way to protect yourself is to immunize your portfolio by matching your investment assets with planned spending liabilities.

We call this a goals-based approach to portfolio construction.  And that’s the most reliable way to invest – particularly in the face of so many economic worries.


HighView Financial Group is an investment counselling firm for affluent families and foundations. We build portfolios based on each client’s unique goals and tolerance for risk. Schedule a complimentary discovery session to see if we’re the right investment stewardship counsellors for you. 

You may also be interested in:

Reduced Fund Payout Is Good But Beware of Unsavoury Sales Pitch

Wednesday, December 16th, 2015

Investment AdvisorI recently wrote about how high-payout monthly income funds are being mis-sold to investors and how some fund companies had provided false and misleading information to at least one end investor. I always take notice of fund distribution cuts so a recent announcement caught my attention. While the announced distribution cut is good news (because it addresses sustainability) it comes with a warning for investors.

Distribution more than halved

This week Sentry Investments announced many changes to its funds, which included slicing Sentry Growth & Income fund’s monthly payout from $0.067 per unit to $0.032 starting in January – a 52% drop. This fund landed on my radar this past spring, at which point I estimated that its distribution would need to fall by 46% (to $0.0357 monthly per unit) in order to be sustainable.

But delaying the decision over the past several months – during which the unit price dropped by 10 per cent – simply exacerbated a clearly unsustainable payout. The delay necessitates a more severe distribution cut than would have been necessary had they done it sooner.

Since nearly 40% of distributions have been taken in cash over the past couple of years, this fund’s investors will feel the pinch of reduced cash flow. The pain will be compounded for those who invested in the fund with borrowed money – which is too common with high payout funds.

Beware the potential sleight of hand

A minority of advisors will likely tell clients not to worry that their fund’s payout will soon fall by more than half – because they can switch into the new version (Sentry Growth and Income T8 in this case) which will target an 8% annualized cash distribution. And anybody hearing this pitch needs to step back and think.

After several years of strong market returns, Sentry Growth and Income couldn’t sustain its 8% payout. Now Sentry thinks it’s prudent to cut the distribution because it can’t be supported in the future. But then why launch another version of the same fund with the same distribution that they’ve just admitted can’t be sustained?

The answer is that funds with high cash distributions are an easy sell. Sentry’s new T8 version will launch at $10 per unit so it will ‘look good’. And it will take some time before this new fund is also forced to start slicing its payout – which I think it will in time. Sadly Sentry isn’t alone. BMO, IA Clarington and Mackenzie are among those who have done exactly the same thing.

This behaviour is shameful because it is focused on creating investment products designed to attract money from investors who are desperately seeking yield in a world with chronically-low interest rates. I’m waiting for a new sweeping trend whereby fund companies remain focused on the prudent investment management principles that built their businesses; and stop launching gimmicky and unsustainable products just to gather more assets. But after 14 years of writing on this topic I’m not holding my breath.


HighView Financial Group is an investment counselling firm for affluent families and foundations. We build portfolios based on each client’s unique goals and tolerance for risk. Schedule a complimentary discovery session to see if we’re the right investment stewardship counsellors for you.

You may also be interested in:

High-payout Funds Are a Cash Flow Mirage

Friday, November 27th, 2015

Investment Savings
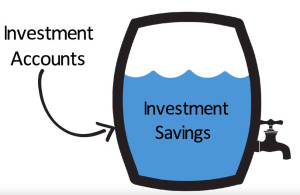
In the world of investing, nothing turns my stomach more than when a member of the investment industry misleads investors and then directly benefits from said misinformation. Usually only subtle trickery is at play. And most often I have seen this in the form of funds sporting unsustainable cash payouts – which I’ve been studying and writing about since 2001.

A ‘High-payout’ Portfolio

An investor recently asked me to give feedback on her portfolio. She has seven figures invested in a bunch of high-payout monthly income funds. On a $1 million investment, this portfolio currently pays distributions of $4,446 monthly – equal to about 5.6% annually net of fees.

Some of the funds pay reasonable and sustainable distributions. But others don’t. I highlighted three concerns:

High Fees, Excessive Distributions, and an Aggressive Asset Mix

At 2.4% annually, fees are at least 70 basis points higher than she should pay for a seven figure portfolio – the typical minimum of licensed discretionary portfolio managers. And since all of it is embedded – instead of charged directly to their account – the after tax cost compared to a more suitable fee is even higher.

Distributions are unsustainably high. I found that this portfolio’s current payout rate is more than 25% higher than the level I estimate is sustainable. This is important given that she relies on the monthly cash payouts to pay for living expenses. But in a world of skinny yields, nobody likes hearing that their cash flowing machine is a mirage.

Finally her nearly 75% allocation to stocks is too aggressive based on my assessment of her willingness and capacity to take on investment risk.

Industry Spin puts Advisor Interests Ahead of Investors

To the distribution sustainability concern, the investor received rather disheartening responses directly from the fund companies with which she’s invested. Responses have been edited to conceal the identity of the companies and for clarity.

The first is from a big bank fund company:

Basically, if a fund grows quickly, and the fund has a fixed distribution per unit, then we will pay out more income than the fund is earning while this happens. We characterize this as RoC [Return of Capital], which is beneficial to all clients (recent purchasers and previous owners).

This defines RoC distributions – i.e. cash payouts that are in excess of actual income and realized capital gains. But it doesn’t address whether the funds in question can sustain their current payouts. Interestingly, it implies a link between sustainability and how much new money is being invested. That’s only relevant in a Ponzi scheme – which these funds are not – or with respect to the payout mechanics but not sustainability.

The second response – focused on one fund – is from a smaller fund company:

Return of capital is a very tax efficient method of generating monthly cash flow. Two things on ROC – most of the yield has been earned and the overall return of the fund over ten years is approximately 8%. However instead of paying out the growth as capital gains and pushing tax every year, we paid out return of capital.

If the client is using the cash flow then there is a deferred capital gain for the client. If however they’re reinvesting the distribution, the ACB should be similar or even higher. If they’re are drawing income the benefit is enjoying the income today and deferring the gain to a future date where the client can then take some out as capital gains.

This response is either deceitful or sloppy. The firm’s own website lists the fund’s 10-year total return at 6.3% per year through October 31 – not 8% as claimed. Big difference since the distribution has averaged just south of 8% annually – and currently equates to 8.5% annually.

$100,000 invested in this fund on October 31, 2005 would have resulted in about $69,000 in total cash distributions by October 31, 2015. The original $100,000, however, would have fallen to about $82,400 had all of the distributions been taken in cash. In other words, the fund paid out so much in cash that it reduced original capital by almost 18%. It did not produce a high-enough return to fully support its cash payouts – contrary to what the firm told our investor; the person to which it owes a fiduciary duty.

Also a fund cannot choose the tax identity of its cash distributions – as the above explanation implies. Funds with investments that pay dividends, interest – and that trigger gains from selling investments at a profit – have taxable income that must be paid out to investors. If fund companies could choose, they’d all pay distributions that attracted no immediate income taxes. A fund can choose, however, to distribute an amount of cash that exceeds its taxable income – the excess being RoC.

People trust the investment industry with their life savings. Yet these fund company responses are aimed at protecting themselves at the expense of the long-term sustainability of their client’s investment assets from which they derive revenue. This sort of conduct has persisted for too long and it needs to change.

And it’s why neither of the above companies manages money for HighView clients and why we do not use products with payout policies designed for asset gathering by appealing to investor psychology rather than for long-term sustainability.

Below, see our latest video on distribution sustainability:


HighView Financial Group is an investment counselling firm for affluent families and foundations. We build portfolios based on each client’s unique goals and tolerance for risk. Schedule a complimentary discovery session to see if we’re the right investment stewardship counsellors for you.

You may also be interested in:

SPIVA Report Interesting but Misses Key Message for Investors

Friday, November 6th, 2015

SPIVA Canada ScorecardS&P Dow Jones Indices (SPDJI) publishes two reports annually comparing the performance of actively managed mutual funds against common financial market benchmarks. The recently-published mid-year SPIVA Canada Scorecard doesn’t paint a flattering picture of Canadian mutual fund returns. Although our client portfolios don’t include the retail versions of funds that SPIVA evaluates, I usually read them to stay informed.

Here are some thoughts that often spring to mind when reading these always-interesting reports:

Free of Survivor Bias

SPIVA reports are useful because their mutual fund database includes all of those old funds that existed at one time but didn’t survive. Many products are launched and if they don’t attract enough investor dollars, they are often ‘killed’ via a termination (where money is returned to investors) or the more common practice of merging a struggling fund into a larger sister fund.

Since funds that don’t survive are often small because of poor performance, excluding them from the historical record makes mutual fund performance look better than if such funds’ past performance is preserved. This is known as ‘survivorship bias’. But there are ways to fine tune SPIVA to offer better insights to readers.

Investable Benchmarks

SPDJI could produce more meaningful comparisons by using investable versions of stock market indices such as exchange traded funds tracking each index. While the likes of iShares, Vanguard and other ETF providers are efficient at tracking indices, there is a cost to obtaining benchmark exposure. And the data is readily available so there isn’t a good reason not to do this.

Divide the Universe

We have distinct types of investors – i.e. do-it-yourselfers and advice-seekers – with funds catering to each. Rather than comparing all funds in a category as a single group, it would be make more sense to carve up each group by the type of investor targeted.

For instance, DIY investors would tend to focus on cheaper funds that don’t have higher fees to pay for advice (e.g. funds offered by Mawer, Beutel Goodman, Steadyhand and Leith Wheeler). This group would surely fare better than ‘load funds’ with higher fees that offer commissions to dealers and brokers – which dominate the fund universe.

Active Management Is Skilled but…

The SPIVA reports don’t touch on an important point. As I touched on in a recent blog post, active management performance generally outperforms benchmarks before deducting fees. SPIVA report data show that this skill is largely absorbed by fees charged to retail investors.

So the more meaningful message is that active management skill exists but that investors must keep an eye on costs because there is a limit to what investors should pay for active management.

Control the Controllable

The message I see in the SPIVA reports – but isn’t in print – is really that successful investing results from taking control over the factors that we can to tilt the odds in your favour as much as possible.

This can be achieved by:

  • translating qualitative descriptions of broad objectives (e.g. I want a comfortable retirement while I’m young enough to enjoy it) into quantifiable goals and time frames (e.g., I need to accumulate $750k by age 62);
  • allocating investment assets to stocks, bonds, cash and other assets to match – as closely as possible – future goals (which often take the form of some future spending plan);
  • making smart decisions on where to hold certain investments (i.e. asset location);
  • obtaining investment exposure with a relatively simple portfolio structure (i.e. get broader exposure rather than buying small slices of financial markets);
  • rebalancing periodically (but not too often) when your overall mix deviates significantly from your target;
  • paying attention to fees when choosing products to obtain desired investment exposure; and
  • tracking your progress so that you know if you are on track to achieve your goals.

>> HighView Financial Group is an investment counselling firm for affluent families and foundations. We build portfolios based on each client’s unique goals and tolerance for risk. Schedule a complimentary discovery session to see if we’re the right investment stewardship counsellors for you.

You may also be interested in: